
Using Google Sheets and My Maps for making decisions
Two years ago, I moved to Salt Lake City for work. After looking around a bit for a rental property close to my new work, it became clear that I would be better off trying to buy a new home than renting if I could afford to do so. At the time the interest rates and property values in Salt Lake City were very low, so monthly mortgage payments were often cheaper than rental prices.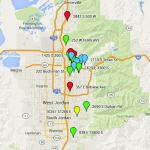
Sitting at the Salt Lake Roasting Company after we first moved here, we found a really nice real estate agent (Jaral Ferwerda). I worked with him diligently to find a home while my lovely wife was buttoning up our home in California.
After a while, I started to find it very difficult to keep track of all the homes I was seeing. They started to blur together, and I wasn’t really able to figure out which one I liked best.
That was when I started a Google Sheet with information that I was getting from my agent. Most days he painstakingly mapped addresses on a Google Map for me to make it easier for me to find the homes in this new area.
The first thing I added to the spreadsheet was a function that let me see how far the home was from my new job. That involved getting a Google API key and writing a script for the spreadsheet (based on one of the examples for Google Script and the Maps API – let me know if you think a post on that would be useful).
About that time, I was inspired about using my Google Maps to keep track of the data on my spreadsheet. At the time there was a beta product called My Places that allowed you to mark up a map and save it. You could do some basic things like map locations, routes and place markers on a map. It also had a feature that let you import address information to the map to drop place markers for you.
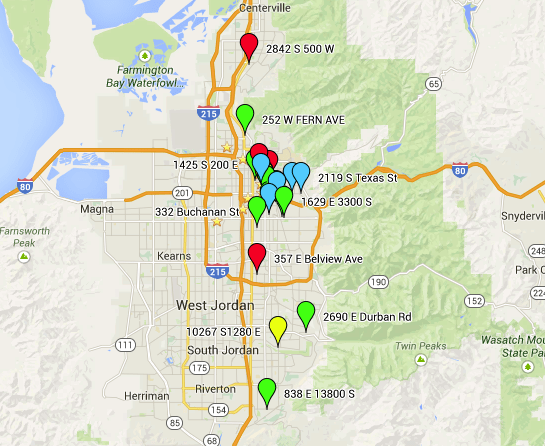
So I imported the spreadsheet to my map, to get something like this (looked a little different back then because it was on the older version of maps):
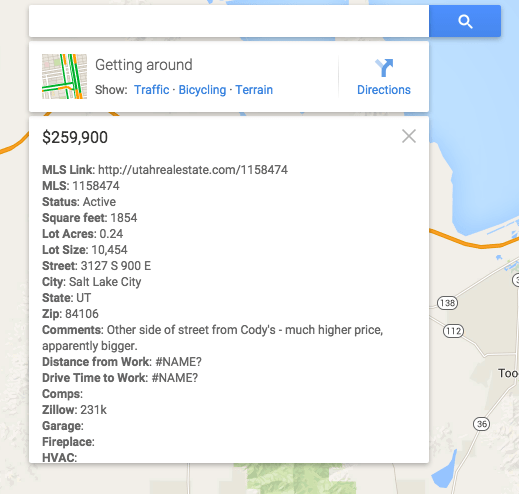
The imported data for each pin would show up when you clicked on it, so I could easily see the price and other information from the MLS that I wanted to keep track of:
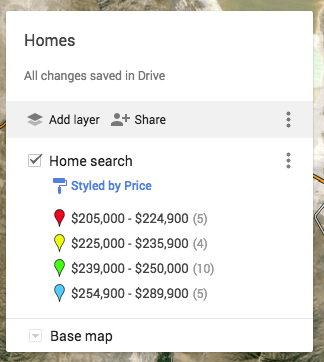
The pins were color coded based on the home price, so I could easily see which were the most affordable, and where they were in relationship to my new office. This is a feature of the My Maps: you can set the pin color based on any bit of data you want. In my case it was home price range:
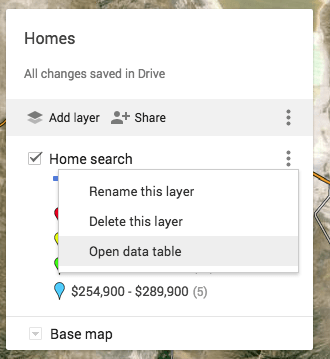
The only down side to this approach is that the data feed is one way (meaning once you update your spreadsheet, or you have to manually enter changes to the data to add new points to your layer). It is possible to edit the data directly on the My Maps by clicking on the layer control (the three vertical dots) and choosing “Open data table”:
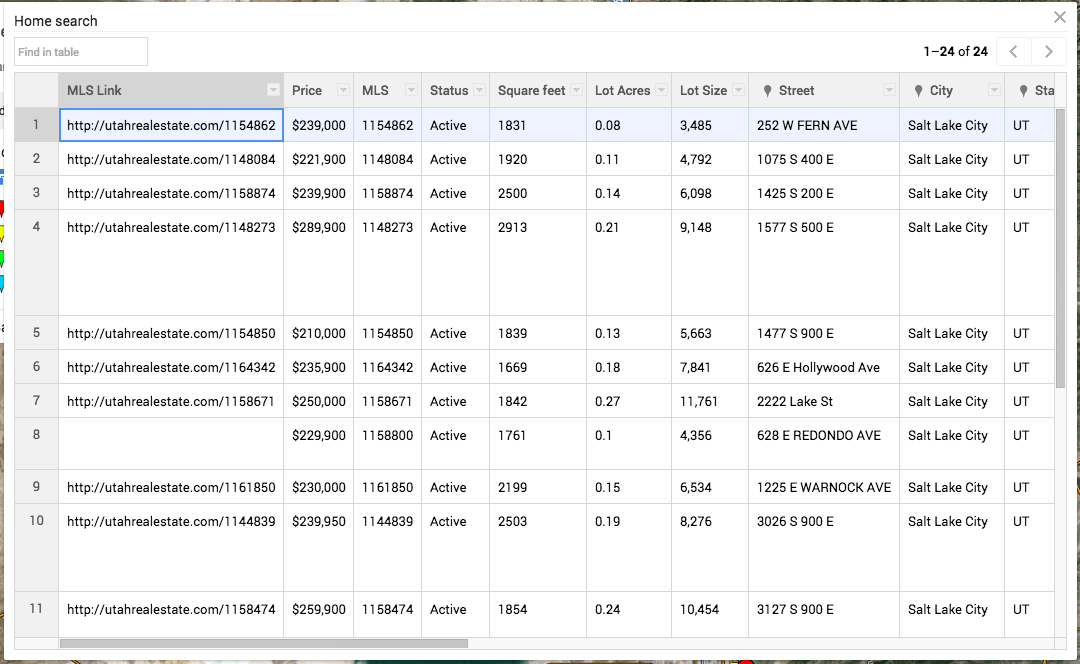
This brings up a rudimentary data entry sheet that you can use to update the underlying data points with:
Related Posts

Delighted To Resolve Unexpected Consequences In Go JSON Marshal

Happy Scavenger Hunt, Or How To Attend A Concert delayed
Note: This post was actually written in 2021, I just found it unpublished in my site, so added a few Firefly images and pushed Publish ...